IC Markets Home Sign in Web Trader Contáctanos
IC Markets Social IC Markets Social

Información para
Operadores Serios

  • Acerca de IC Markets
  • ABRA UNA CUENTA BURSÁTIL
  • PRUEBE UNA DEMO GRATIS
  • Comienza a Operar
  • VISIT OUR BLOG
IC Markets Social
  • Acerca de IC Markets
  • ABRA UNA CUENTA BURSÁTIL
  • PRUEBE UNA DEMO GRATIS
  • Comienza a Operar
  • VISIT OUR BLOG
May 24, 2022North_American_Stocks_enIC Markets

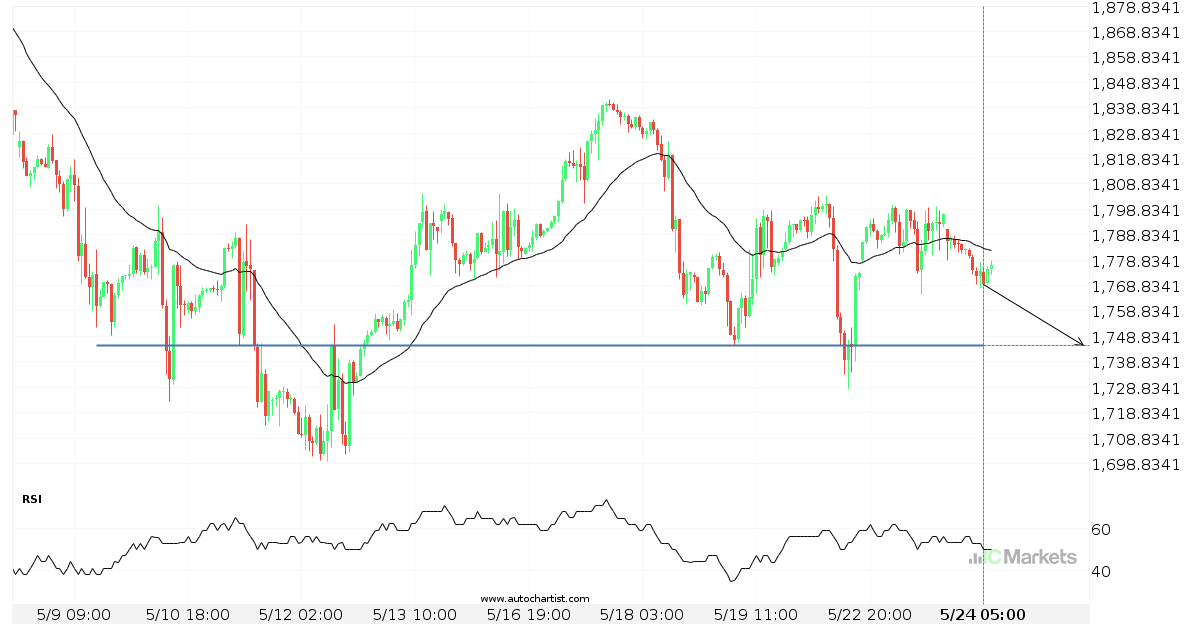
A final push possible on US Small Cap 2000 Index

US Small Cap 2000 Index is heading towards 1745.2400 and could reach this point within the next 3 days. It has tested this line numerous times in the past, and this time could be no different, ending in a rebound instead of a breakout. If the breakout doesn’t happen, we could see a retracement back […]

Read more
May 23, 2022North_American_Stocks_enIC Markets

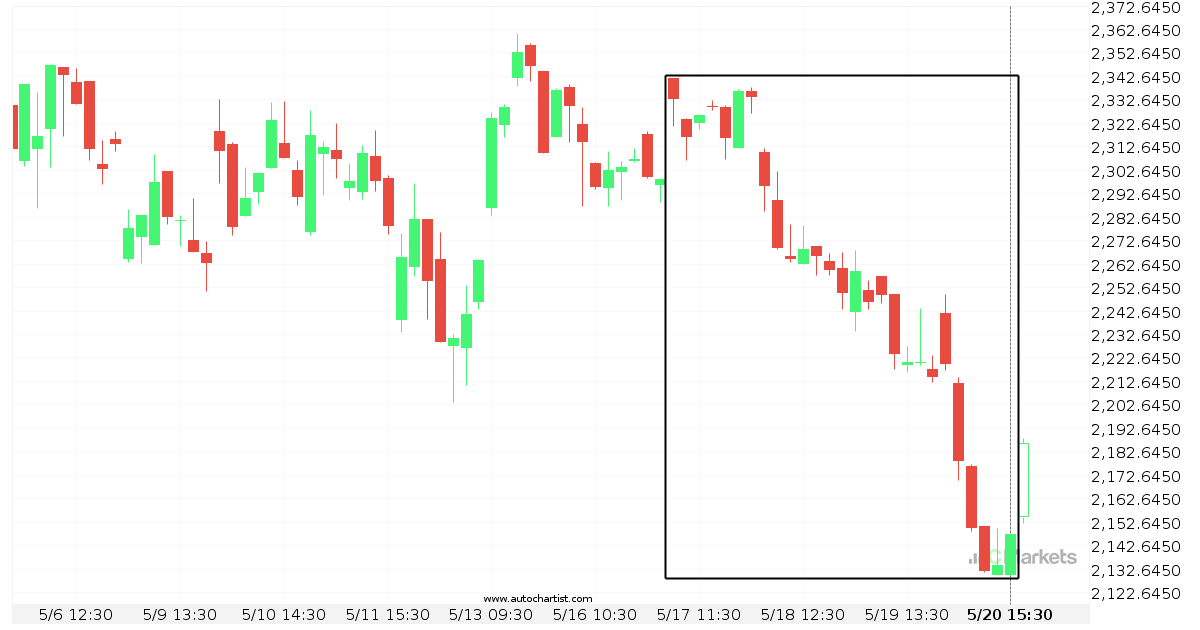
Huge bearish move on ALPHABET INC CLASS C

ALPHABET INC CLASS C has moved lower by 7.94% from 2,341.73 to 2,147.46 in the last 4 days.

Read more
May 20, 2022North_American_Stocks_enIC Markets

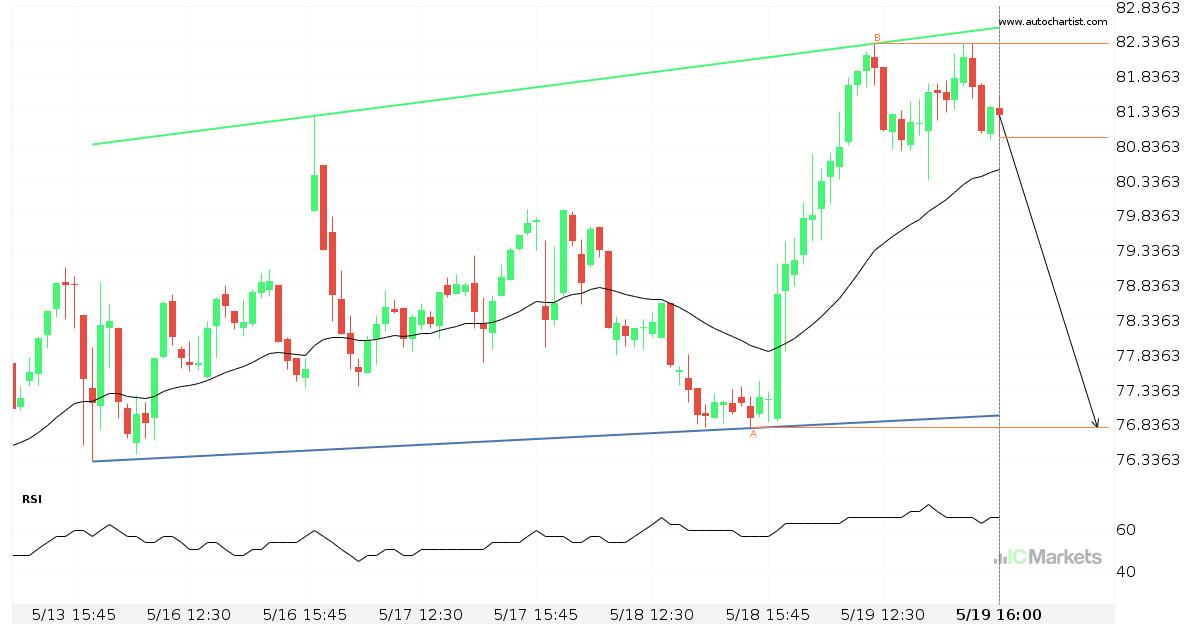
Should we expect a breakout or a rebound on Paypal Holdings Corp?

The movement of Paypal Holdings Corp towards the support line of a Channel Up is yet another test of the line it reached numerous times in the past. This line test could happen in the next 8 hours, but it is uncertain whether it will result in a breakout through this line, or simply rebound […]

Read more
May 19, 2022North_American_Stocks_enIC Markets

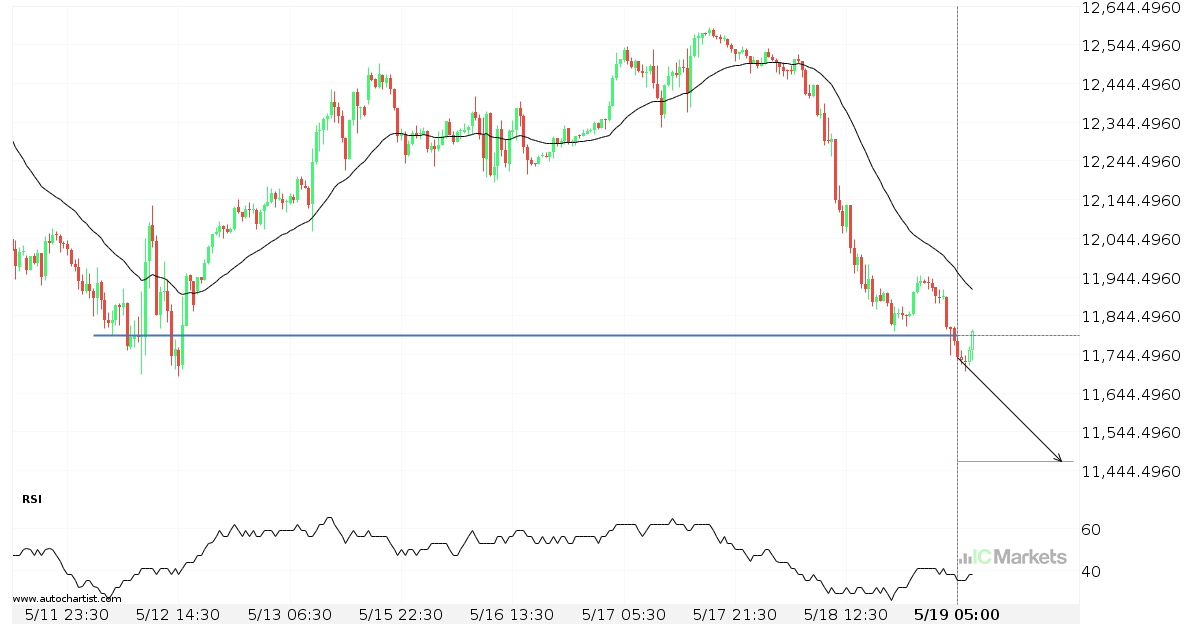
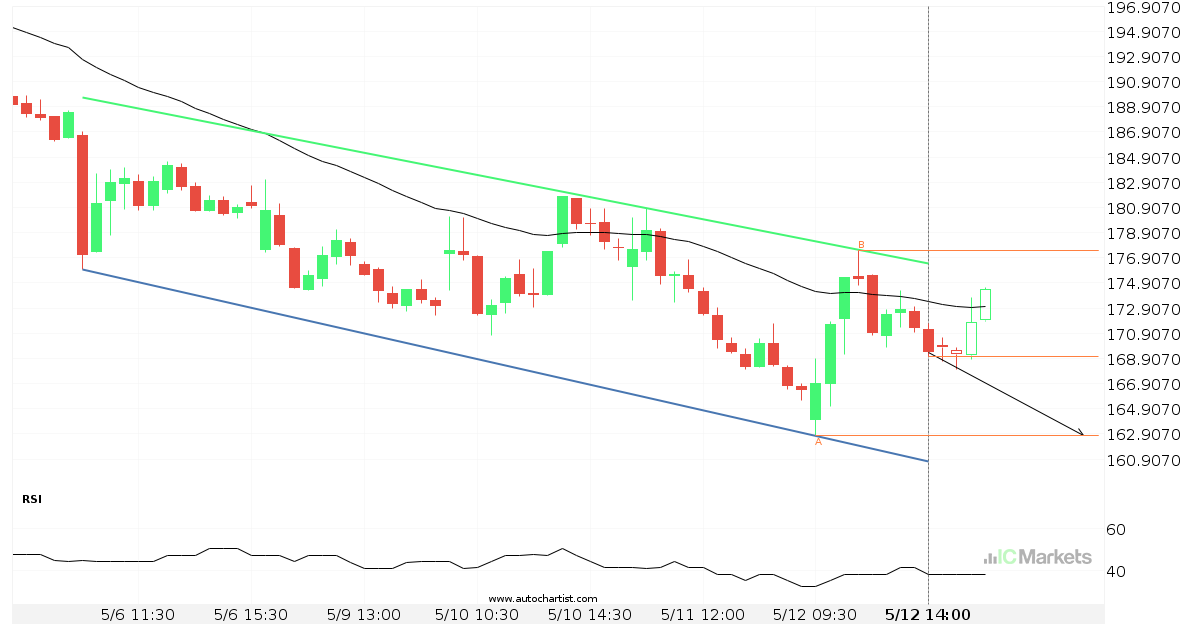
Big movement possible on US Tech 100 Index

US Tech 100 Index has broken through a line of 11792.5996 and suggests a possible movement to 11468.5801 within the next 2 days. It has tested this line numerous times in the past, so one should wait for confirmation of this breakout before taking any action. If the breakout doesn’t confirm, we could see a […]

Read more
May 18, 2022North_American_Stocks_enIC Markets

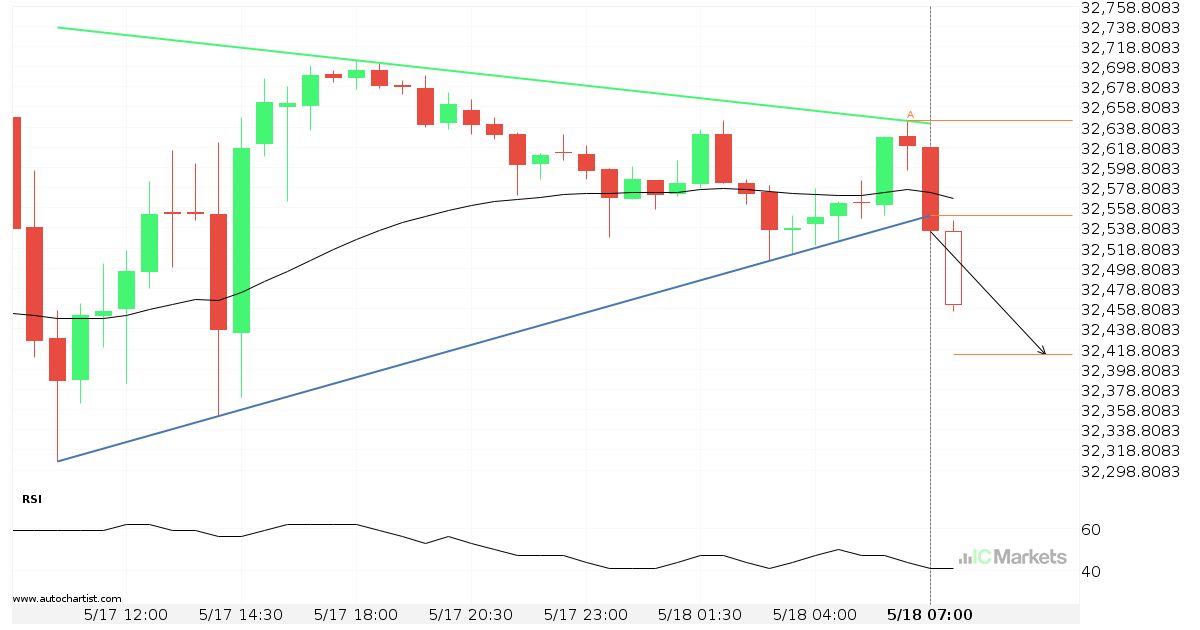
Possibility of big movement expected on US Wall Street 30 Index

US Wall Street 30 Index has broken through a support line of a Triangle and suggests a possible movement to 32413.6982 within the next 6 hours. It has tested this line in the past, so one should probably wait for a confirmation of this breakout before taking action. If the breakout doesn’t confirm, we could […]

Read more
May 17, 2022North_American_Stocks_enIC Markets

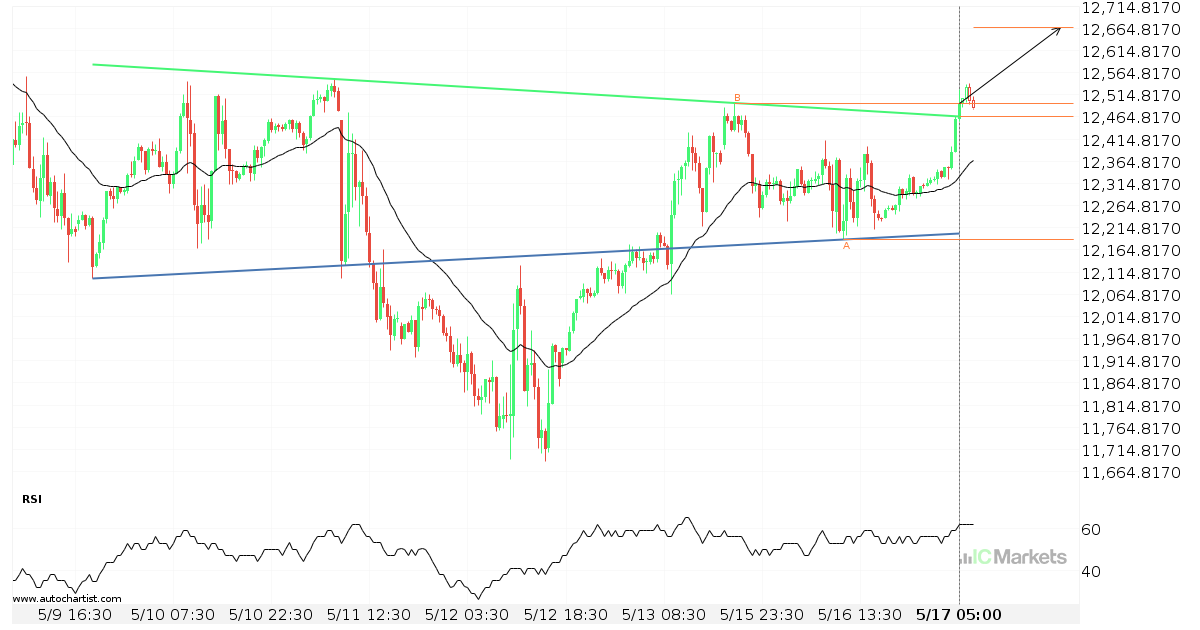
Possibility of big movement expected on US Tech 100 Index

US Tech 100 Index has broken through a resistance line of a Inverse Head and Shoulders and suggests a possible movement to 12665.9115 within the next 2 days. It has tested this line in the past, so one should probably wait for a confirmation of this breakout before taking action. If the breakout doesn’t confirm, […]

Read more
May 16, 2022North_American_Stocks_enIC Markets

Possible breach of resistance level by Tesla Inc.

Tesla Inc. is moving towards a resistance line which it has tested numerous times in the past. We have seen it retrace from this line before, so at this stage it isn’t clear whether it will breach this line or rebound as it did before. If Tesla Inc. continues in its current trajectory, we could […]

Read more
May 13, 2022North_American_Stocks_enIC Markets

Netflix Inc. approaching support of a Channel Down

Netflix Inc. is approaching the support line of a Channel Down. It has touched this line numerous times in the last 7 days. If it tests this line again, it should do so in the next 7 hours.

Read more
May 12, 2022North_American_Stocks_enIC Markets

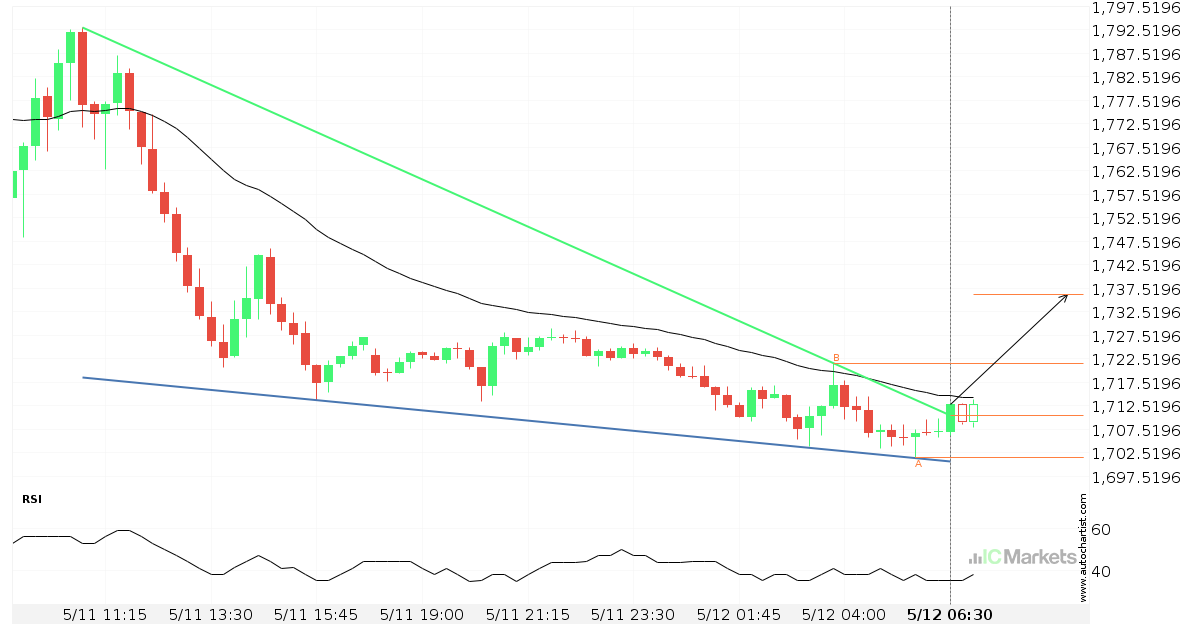
Possibility of big movement expected on US Small Cap 2000 Index

US Small Cap 2000 Index has broken through a resistance line of a Falling Wedge and suggests a possible movement to 1736.1099 within the next 5 hours. It has tested this line in the past, so one should probably wait for a confirmation of this breakout before taking action. If the breakout doesn’t confirm, we […]

Read more
May 11, 2022North_American_Stocks_enIC Markets

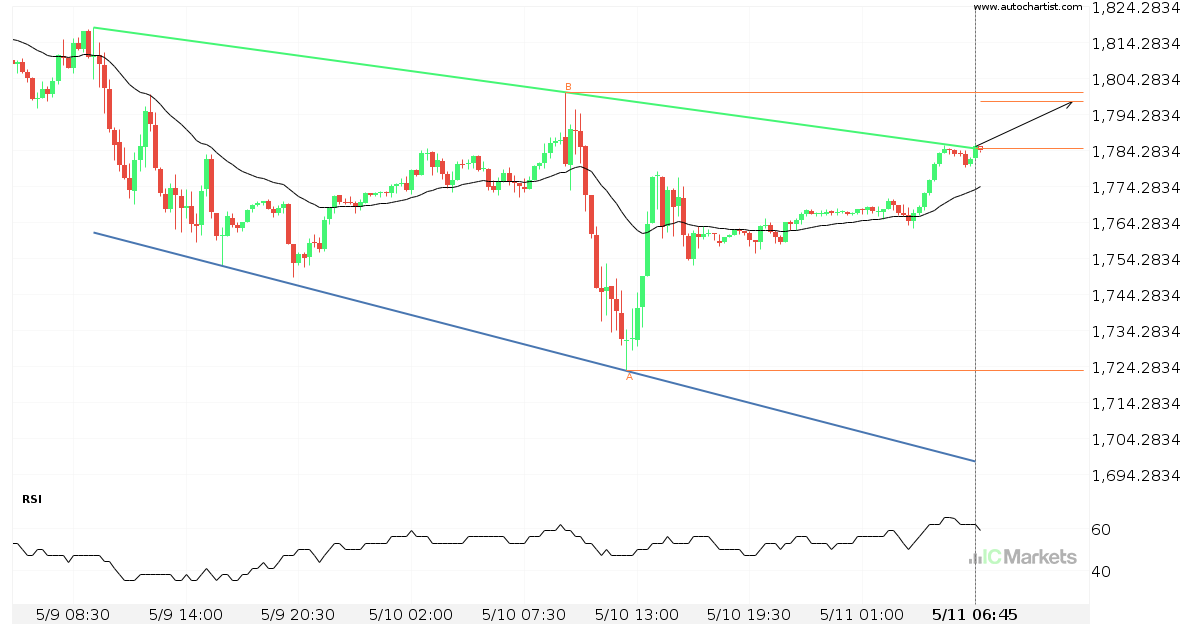
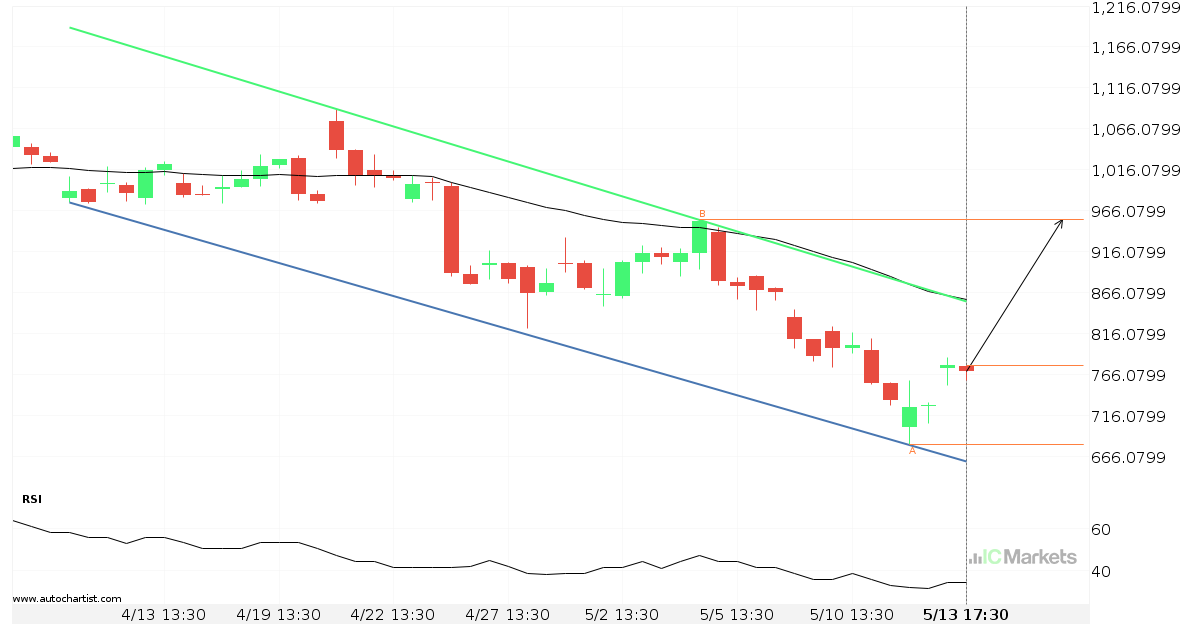
Resistance line breached by US Small Cap 2000 Index

US Small Cap 2000 Index has broken through the resistance line which it has tested twice in the past. We have seen it retrace from this line before, so one should wait for confirmation of the breakout before trading. If this new trend persists, a target level of around 1797.7185 may materialize within the next […]

Read more
  • 1
  • 2
  • 3
  • …
  • 11
  • 12
  • 13
  • 14
  • 15
  • 16
  • 17
  • …
  • 45
  • 46
  • 47

Recent Posts

  • US Wall Street 30 Index – المستوى الرئيسي – مقاومة
  • Brent Oil vs US Dollar – نموذج الرسم البياني – قناة صاعدة
  • Brent Oil vs US Dollar – نموذج الرسم البياني – قناة صاعدة
  • Hong Kong 50 Index – نموذج الرسم البياني – مثلث صاعد
  • Hong Kong 50 Index – รูปแบบกราฟ – สามเหลี่ยมขาขึ้น

Recent Comments

    Traducción


     Edit Translation

    Opere con un

    líder del mercado en el que puede confiar

    ABRA UNA CUENTA BURSÁTIL PRUEBE UNA DEMO GRATIS

    Trading en Forex

    • Qué es Raw Spread
    • Resumen de cuentas
    • Abre una Cuenta
    • Trader Launch en Web

    Especificaciones de Trading

    • Spreads y Comisiones
    • Rango de Mercados
    • Horas de Trading
    • Depósitos
    • Retiros

    Acerca de IC Markets

    • Help Center
    • Por qué con IC Markets
    • Regulación
    • Documentos Legales
    • Contáctanos


    Forex Trading

    • Accounts Overview
    • Open an Account
    • Launch Web Trader

    Trading Specifications

    • Spreads and Commissions
    • Range of Market
    • Trading Hours
    • Funding
    • Withdrawal

    About IC Markets

    • Chat with a Specialist 24/7
    • Why IC Markets
    • Regulation
    • Legal Documents
    • Contáctanos

    Descargo de responsabilidad: Estos documentos son material de marketing cuyo contenido es publicado solo con propósitos informativos. Este material no contiene y no debe ser considerado un consejo de inversión y recomendaciones, o sugerencias para llevar a cabo otras acciones con los instrumentos financieros. Los widgets integrados pertenecen a sus autores independientes externo, y IC Markets no es responsable de su contenido o cómo afectan en las operaciones.

    Derechos reservados de todo el contenido. Las opiniones de los autores tal vez no coincidan con la opinión de los editores del blog. Cuando copie material de este sitio o conecte RSS para volver a publicar nuestros artículos, es obligatorio el enlace a IC Markets o la atribución en el formato “Blog de IC Market”. Para dudas generales, por favor, póngase en contacto con la oficina editorial a través de la página “Contacto”.

    Advertencia de riesgo: Operar derivados conlleva un altor riesgo en su capital y solo debería operar con capital que puede permitirse perder. Las operaciones con derivados podrían no ser adecuadas para todos los inversores, por lo tanto, asegúrese de entender por completo los riesgos que conlleva y buscar asesoramiento independiente si fuera necesario. Una Declaración de Divulgación del Producto (PDS, por sus siglas en inglés) se tendrá en cuenta antes de participar en una transacción con nosotros.

    Los contenidos de esta página son solo información general y no tienen en cuenta su situación personal, objetivos financieros o necesidades. Depende de usted garantizar que los productos que ofrecemos se ajustas a sus necesidades específicas. No debería operar con nosotros a menos que entienda las características y riesgos de los productos que ofrecemos. Esto significa que tal vez necesite buscar asesoramiento independiente antes de empezar a operar con nosotros.

    © 2022 Raw Trading Ltd | All rights reserved.
    • Sample Page